Learn how to set goals for each member of your team. Access real-time information and track the progress of your business. Goals allow you to define an ideal monthly performance level for specific actions to be achieved by team members.
A) Settings:
1. Definitions and Types of Objectives:
Objectives can be defined at the Company, Agency, or Agent level:
Company – all members of the company share the same objectives.
Agency – the agents/team members within each agency share the same objectives.
Agent – each agent within the company or agency has different objectives.
In this case, the administrator may choose to hide certain objectives for each agent if they are not relevant to their role (for example, if an agent does not acquire new properties and only handles sales, they should not have objectives related to property acquisition). To do this, the administrator must access the user’s personal objectives and deactivate the respective group.
Objectives are defined in relation to Listings and Sales:
Listings:
-
Number of opportunities to create.
-
New properties to create
-
Meetings.
-
Number of emails to send.
-
Number of calls to be made.
Sales:
-
Number of sales opportunities to generate.
-
Number of visits to to be made.
-
Number of sales to complete.
-
Meetings.
-
Number of emails to send.
-
Number of calls to be made.
Notes:
In order for the email count objective to be activated, it is essential that the Email Importer tool is enabled. Learn how to configure the email importer in the article “What is the Email Importer and how to configure it.”
All team objectives are monthly; however, the user can configure different target values to be achieved for each month.
2. Display Rules:
The display rules are as follows:
Does the agent have personal objectives?
Yes → the agent’s personal objectives are displayed.
No → are there agency objectives associated with the agent’s agency?
-
If no agency is associated with the agent → the company objectives are displayed.
-
If no agency objectives exist → the company objectives are displayed.
-
If yes → the agency objectives are displayed.
3. How to Configure Team Goals:
Configuring company team goals:
In the Settings area, go to General Data – Team Goals.

Configuring agency team goals:
In the Settings area, go to Agency Data – Objectives.


Administrators can configure personal objectives by going to Users > List and accessing the Personal Goals tab of the contact.


On this page, administrators can also select which objectives are appropriate for each agent using the “Active” option.

These numbers will be set for all months of the year. However, if you want to have different objectives for each month, activate the “Define by month” option and enter the target number for each month.

B) Reports
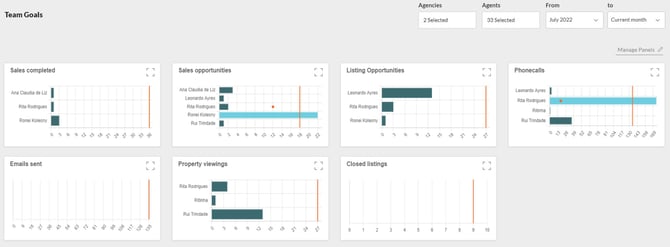
1) Tracking Results:
Get an overview of all objectives configured for the company, agency, and users.
-
Go to Reports – Team goals.

-
Use the filters to view the information:
Reports can be filtered by Agency and by Agent.

The period to be viewed can be set to weekly or monthly.

View the information based on the filters applied in the charts below:
In this area, you can also make the following changes:
-
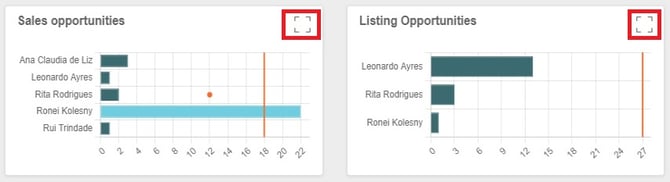
Expand the chart:
Click the option below to view the chart in more detail
-
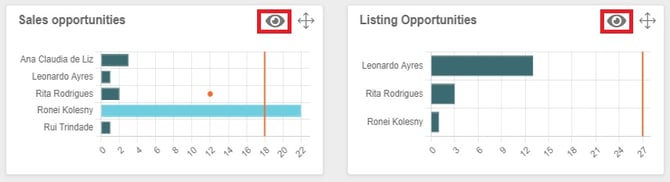
Manage Dashboards:
You can show or hide a chart and reorder it in any way you wish. This is a setting that each agent can configure in their own account.

To show or hide a chart, click the option below:
If you want to reorder the displayed information, click “Position” and move the chart to your desired order.
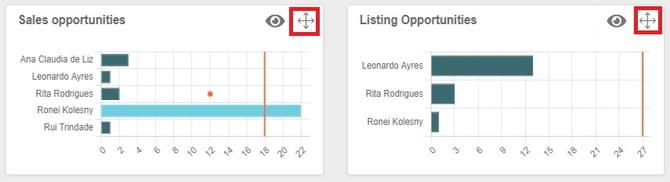
After making the changes, click “Save.”
2. Understanding the Displayed Information:
Reading the presented information:
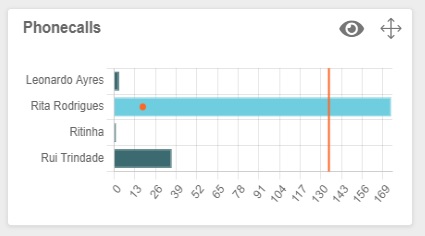
Each graph represents an objective and should be interpreted as follows:
-
X-Axis: shows all the agents that have contributed to the objective.
-
Y-Axis: represents the number of actions performed by that user.
-
Orange line: the objective of the team, company, or agency.
-
Orange dot: the personal target for that agent (will only be visible if the target is configured)
3. Results Tables:
The tables will display the results according to the applied filters.
Agents Table: shows all company agents, the defined objective, and what they have achieved so far, highlighted in orange.
Example:
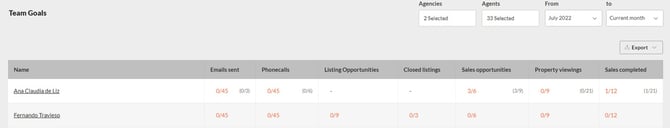
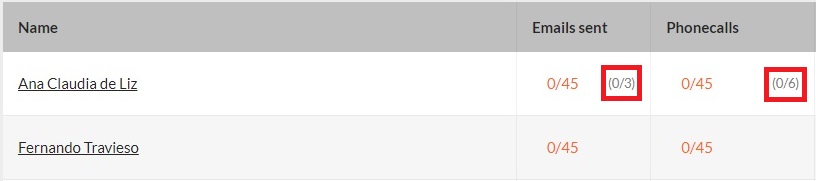
For this case, we see that this agent's goal is x e-mails sent (on the right side) and so far he has sent only y, and so on for the following metrics.
In this table, if the agent has set some personal goals, each column also shows in grey the current state of that goal compared to what was set as a personal goal.
If there is more than one agency, there will be one more table in addition to the previous one:
Agencies objectives table - shows all agencies (each row corresponds to one agency) and the sum of the objectives of all agents in each agency (the objectives will be multiplied by the number of members of that agency).
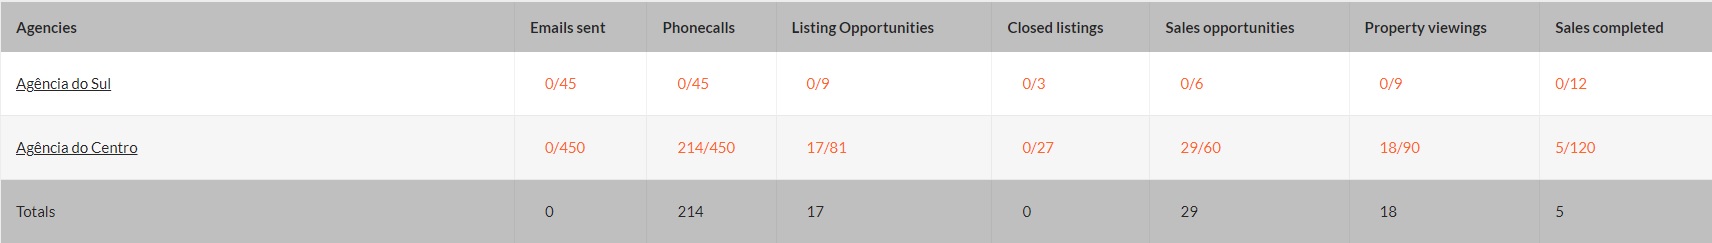
Each column shows the current state of an objective compared to what was set for the company/agency:
-
If it has been achieved, it turns green.
-
If it is not achieved, it turns red.
-
Each chart will show at the end the totals of the objectives achieved in each column.
The tables can be exported as CSV and Excel files.

4. Objectives Charts in the Dashboard:
In the Dashboard area, click the “Manage Panels” button to add the new charts.


The charts you can select are as follows:
-
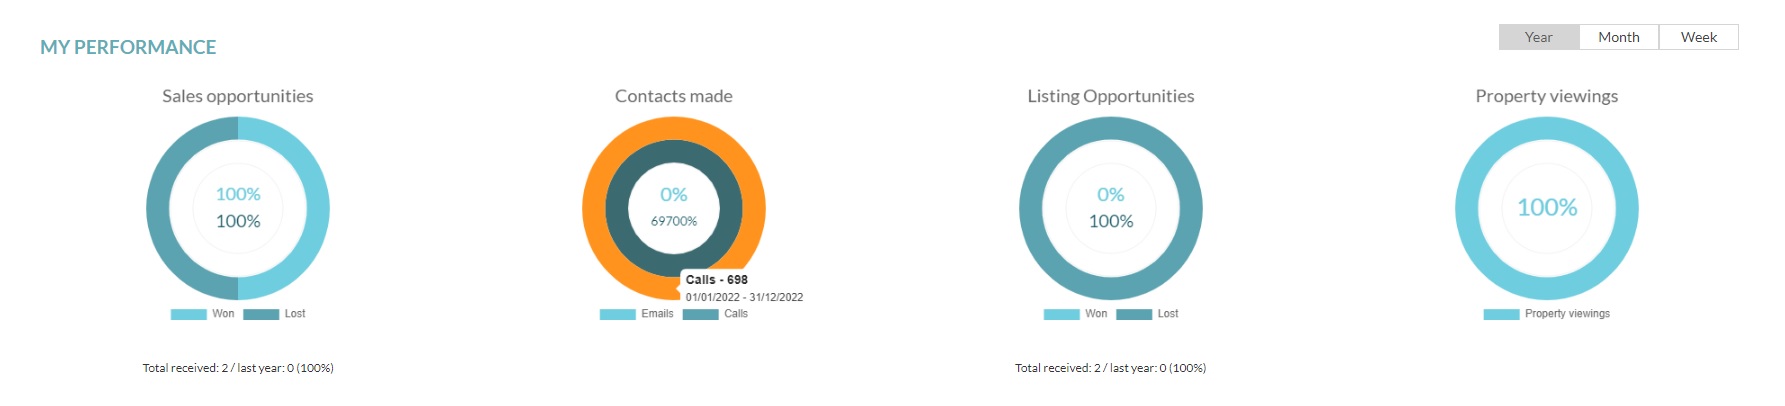
Overall performance graph (includes all team goals):
Compares user/team performance over two time periods on four different objectives: sales opportunities, contacts made, canvassing opportunities, and property visits made.
It is always a comparison of the performance between the same last period of time. So, if we choose the filter "Month", it will show the results of last month and the current month:
The performance of the current period is in the circle outside
The latest performance period is in the inner circle
To see the totals and time period for each graph/variable, hover the mouse over the graph.
-
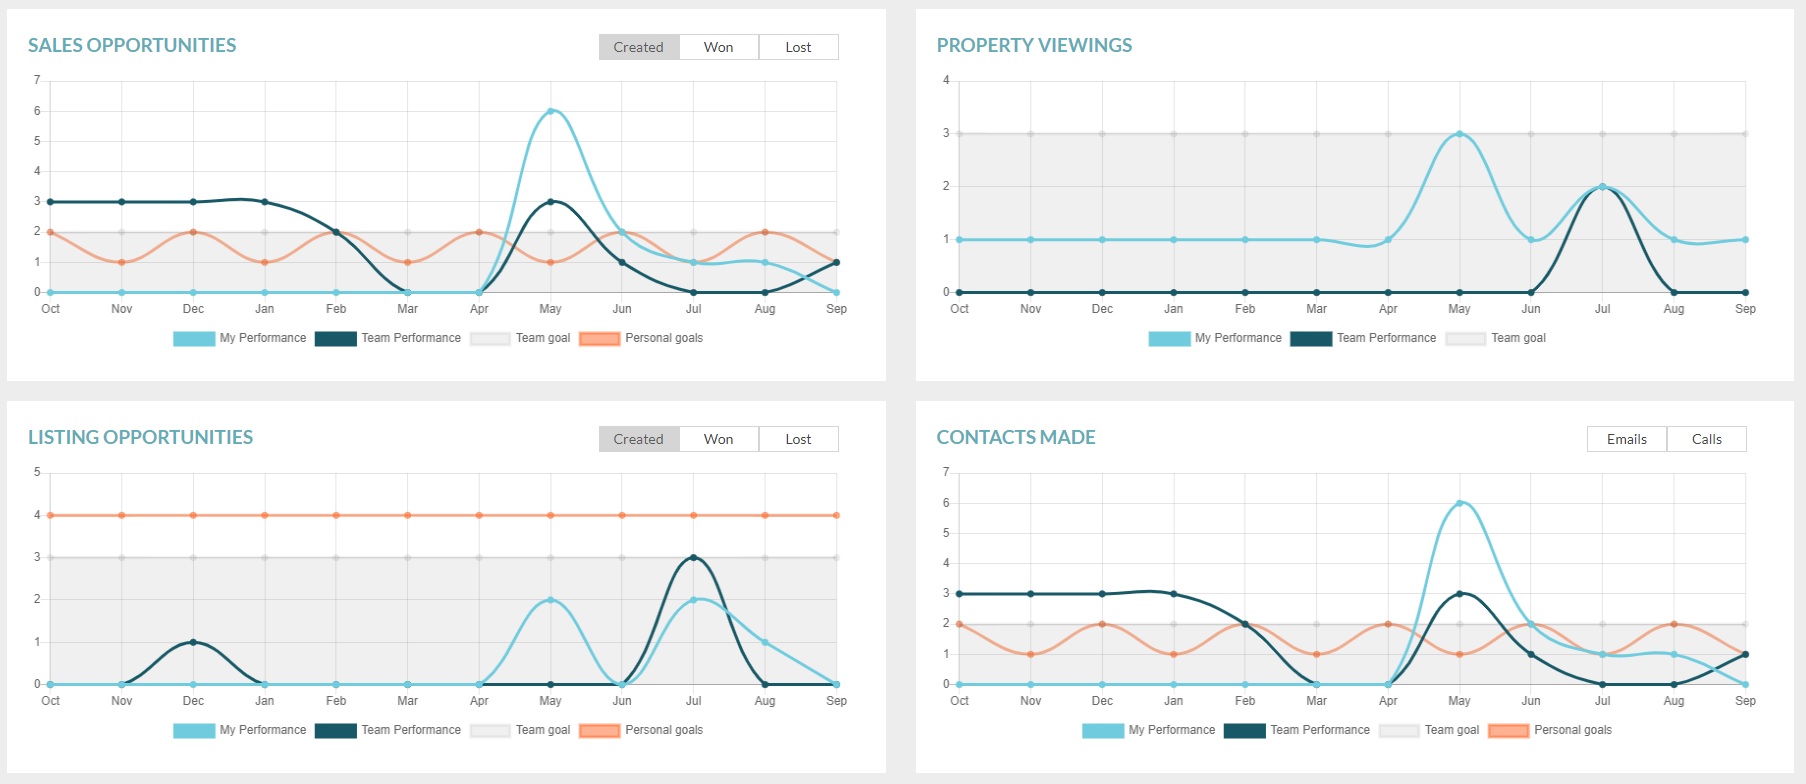
Sales opportunity Graph
Overview of user/team performance and goals on sales opportunities for the current month and last 11 months. Filter by all won or lost opportunities.
-
Property Viewings Graph
Overview of user/team performance and goals on property viewings for the current month and last 11 months.
-
New Listing opportunities Graph
Overview of user/team performance and goals on new listing opportunities for the current month and last 11 months. Filter by all won or lost opportunities.
-
Graph of contacts made
Overview of user/team performance and contact targets for the current month and over the past 11 months. Allows filtering by phone calls or e-mails.
For all these graphs, except the general performance one, hover the mouse over each of the lines to see the performance and what each one represents, taking into account the defined goals.
-
Global Overview Chart: shows the overall view of the entire company, and the results can be viewed according to user groups.


This functionality is available in the PREMIUM Plan.
For more information, send an email to: help@casafaricrm.com