See the main data of your business in a quick and intuitive way, with the possibility of saving them to consult updated information!
Learn in this article how to view, create and consult graphs:
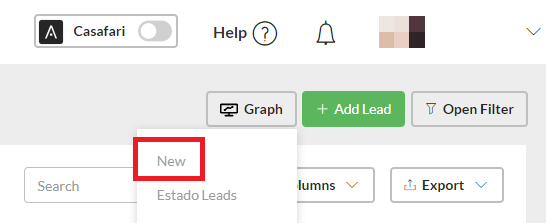
See information:
1. Go to Leads/Business - Sales and/or Listings.
2. Click on the option “Graph” - “New”.
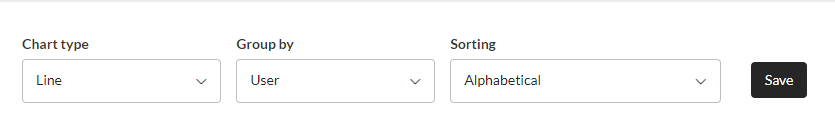
3. In the filters, indicate the graph type, grouping and sorting.
Save for recurring consultation:
1. Go to Leads/Business - Sales and/or Listings.
2. Click on the option “Chart” - “New”.
3. In the filters, indicate the chart type, grouping and sorting.
4. Click on “Save”.
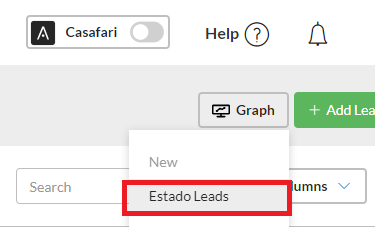
Consult the saved graph on a recurrent basis:
1. Go to Leads/Business - Sales and/or Listings.
2. Click on the option “Graph”.
3. In the list, view the saved graphs and click to access the one you want to see.
Esta funcionalidade está disponível para todos os utilizadores do CASAFARI CRM.
For more information, please send an email to: help@casafaricrm.com